CCNA Deep Dive #1:
Cisco CLI and Packet Tracer Basics
Lab 1: Packet Tracer User Interface Basics
Introduction
Lab 1 introduces basic Cisco Packet Tracer (PT) features, starting with a pre-supplied file. In particular:
Part A: Download and Open a .pkt File – Sounds simple, and it is, but you have to start somewhere. The entire CCNA 200-301 Deep Dive series uses labs that begin with “download and open a .pkt file”; now’s the time to get used to the process.
Part B: Device Info and Access – Learn how to use the PT user interface, particularly the main window, to discover facts about each device in the supplied topology and how to access the CLI of each device.
Bonus: Miscellaneous PT User Interface Experiments – The bonus section exists for those who finish the core of the lab. If you finish the earlier parts, and would like more to learn, use the Bonus section. This bonus section walks through the steps to add a new LAN switch to the existing topology.
Part A: Download and Open a .pkt File
Throughout the CCNA 200-301 Deep Dive course series at O’Reilly Online Learning, the labs will begin with a pre-supplied .pkt file. In part A of this lab, you do just that: download a file, open it in Packet Tracer (PT), and begin to experiment with using PT. Part A simply begins the journey.
In this Lab Part, you will take these steps:
A.1 Create Directories
A.2 Open PT File from /Working
A.3 Make Changes, Save Changes, and Prove Changes were Saved
For reference, Figure 1A-1 shows the lab topology used in this lab.
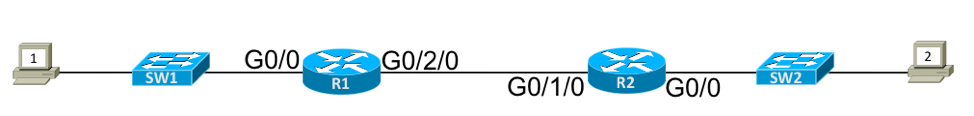
Figure 1A-1 – Lab 1 Topology
A.1 Create Directories
Download a .pkt file, which our labs will often call a “PT file”. Set one copy aside to leave unchanged and locate one in a directory where you can save changes to the file. To do so, follow these steps:
- First, create a directory where you intend to keep your .pkt files for this class, with subfolders /original and /working. For instance, create a directory /deepdive, with subdirectories /deepdive/original and /deepdive/working.
- Download the .pkt file for this lab as identified by the instructor and put a copy in both the /original and /working subfolders.
- For the purposes of the class, you will open and save files in the /working subfolder and keep the files in the /original folder unchanged, in case you want to start over with the original file.
Note: Your computer may attempt to open the file when you click the “Download .PKT File” button in lab. Depending on what apps you have installed, your computer may try to open the .pkt file in an app other than Packet Tracer. If so, just download the file by right-clicking the “Download .PKT File” button to pull up a menu. Then use the steps below to open the file.
A.2 Open PT File from /Working
Next, open the Packet Tracer (PT) application and open the .pkt file in the working directory:
- Start PT as you would any other application on your OS.
- You will likely be prompted to supply login information for your cisco.com account that you used when downloading PT. Use those credentials to login.
- Once logged in, you should see the PT user interface with no devices in the topology window.
- From the application menu items, choose File…Open to open a dialogue box that lets you navigate to the file you want to open.
- Use the PT dialogue box that appears, navigate to the /working subdirectory that you just set up.
- Choose the .pkt file you downloaded for this lab and click the Open button.
- PT will open the PT file, populating the main PT window with a small network topology that looks like Figure 1A-2:

Figure 1A-2 – Packet Tracer User Interface with Lab 1 Topology
A.3 Make Changes, Save Changes, and Prove Changes Were Saved
Next you should prove that topology changes will be saved in the .pkt file. To do so, move some icons, save the file, and re-open:
- Mentally choose any icon in the topology – PC, switch, or router.
- Click-and-hold the icon and slide the icon to another location in the window.
- Do so for any other icons.
- Point to application menu item File… New. When prompted, you should click yes to save your file.
- Because you answered yes to the prompt, you saved the .pkt file.
- Open the file again, using File… Open. (Continue to work only from the /working subdirectory.)
- Look at the topology. Do the icons appear in the topology where you placed them? ________________________
Part B: Device Info and Access
In part B of this lab, you will experience methods of seeing information about each device and how to access the Command Line Interface (CLI) of routers and switches. The lab uses the same .pkt file as in Part A.
In this Lab Part, you will take these steps:
B.1 Learn about Device Interface Identifiers
B.2 Toggle Off the Display of Cable Interface IDs
B.3 Explore the Device Detail Window
B.4 Navigate Among Many device Detail Windows
B.5 Adjust Your CLI Window Settings

Figure 1B-1 – Lab 1 Topology
B.1 Learn about Device Interface Identifiers
Look at the summary of device interfaces for each device in the lab topology, as follows:
- If not already open, open the .pkt file for this lab from the /working directory. Ask the instructor if unsure about what file to use.
- In the topology window, point and hover over each icon in succession. A window of interface information should appear.
- Based solely on these popup windows, find each interface that has an IP address configured. For those interfaces, record the device name, interface ID, and IP address in the table (or re-create the table in your lab notebook.) Examine PCs, switches, and routers.
| Device | Interface | IP address |
| . | . | . |
| . | . | . |
| . | . | . |
| . | . | . |
Table 1 – Interface IP Addresses in Lab 1 Part B
B.2 Toggle Off the Display of Cable Interface IDs
The topology window lists the interface IDs near each cable (assuming you still use default settings.) However, the interface IDs often clutter the screen. In this step, you will disable the display of interface IDs, but learn how to view the interface IDs when needed.
- Locate the PT application menu bar at the top of the screen – not in the PT Window – that lists menu items like “File”, “Edit”, “Options”…
- From that menu, you should open the preferences window:
- Windows/Linux: Choose “Options… Preferences”.
- macOS: Choose “Cisco Packet Tracer… Preferences”.
- From the preferences window that appears, choose the left-most tab “Interfaces”, and make these selections:
- Un-check the box for “Always Show Port Labels in Logical Workspace”.
- Check the box for “Show Port Labels When Mouse Over in Logical Workspace”
- Un-check the box for “Show Device Model Labels” to further reduce clutter.
- Click the red X button in the upper left of the preferences window to close the window.
- Look at the topology window and note that it no longer displays the interface IDs or the device types. However, to see the interface IDs: Hover the mouse pointer over any cable. After a few seconds, the interface IDs should appear.
B.3 Explore the Device Detail Window
Next, you can find more details about any device by clicking the device icon to open a detail window that itself has multiple tabs. To experiment, do so for router R1:
- From the primary PT window, which displays the lab topology, open the detail window for router R1 by clicking the R1 icon.
- Look inside this new device detail window for tab buttons. These buttons let you see different views of the device.
- If not already selected, pick the “Physical” tab from the list of tabs in router R1’s detail window. Within the physical tab’s display, use Zoom and scrolling to look at the simulated physical side of the router.
- Arrange the main PT app window and the R1 device detail windows so you can see both at the same time. You may need to resize the main PT window.
- Click the R1 device detail window’s Config tab, and then hover over the R1 icon in the topology view. Compare the list of interface IDs found in each location (they should be the same.)
- From the R1 device detail window, in the Config tab, change the “Display Name” to your first name. Notice the name also changes in the PT topology window.
- Open and test the CLI interface for router R1:
- From the R1 device detail window, click the “CLI” tab
- Then click in the middle of the window
- Press enter a few times; you should see new command prompts appearing.
- Type show version and press enter. Some lines of output should appear. (Do not worry if you do not know what the output means yet. You just issued a CLI command. Right now, it’s just a way to make sure the CLI is responding to you.)
B.4 Navigate Among Many Device Detail Windows
Experiment with navigating between the various PT detail windows for each device. You can work on your own, or follow these steps:
- From the main PT app window, open the detail window for PC1, SW1, and R1 by clicking their respective icons. Note the behavior of how the detail windows are hidden.
- In the SW1 and R1 detail windows, click the CLI tab in the detail window. Then click in the middle of the window, and press enter, to confirm the device is responding at the CLI. The screen should change a little each time you press enter. You could also issue the show version command and press enter on each device.
- Similarly, on PC1, click the Desktop tab in the detail window, and then click the Command Prompt icon. Then click in the middle of the window, and press enter, to confirm the device is responding at the Command Prompt. You could also issue the ipconfig command and press enter on each device.
- To make it easier to navigate between windows, you can click the “Top” checkbox in the windows, which keeps the windows on top of the main PT Window. Experiment with that feature.
- Additionally, experiment with a PT preference that gives you a taskbar that lists the detail windows, as follows:
- Navigate to the PT preferences window again.
- Click the “Miscellaneous” tab and enable the “show device dialog taskbar” option.
- Close the preferences window.
- Look towards the lower left of the main PT window for a set of rectangles that list the name of each device that you have already opened. Experiment clicking these icons to move around between the device detail windows.
B.5 Adjust Your CLI Window Settings
Throughout the Deep Dive course series, and in your own lab time, you will use the PT CLI windows a lot. To make that experience better for you, experiment with the CLI window settings in PT preferences.
- Click the main PT app window to focus on that window.
- On the PT app menu bar, choose “Cisco Packet Tracer… Preferences”.
- From the preferences window that appears, choose the tab “Font”, and make these selections:
- In the dialogs section, which includes “CLI”, choose a different font size.
- In the colors section, choose a different color for both “Router IOS Text” and “Router IOS Background”.
- Click the red X button in the upper left of the preferences window to close the window.
- Go back to the router R1 CLI window to decide if you like the new font size and color.
- Experiment with making further changes to the CLI font, size and colors until you find a combination you like.
Bonus Part: Miscellaneous PT User Interface Experiments
For those of you who finish the lab (Parts A and B) before class begins again, consider doing the following activities until we reconvene class:
-
- Explore the other tabs within the detail window for one of the routers. Try changing any settings that can be changed that look interesting. Note that the next lab will start will a new .pkt file, so do not worry about making mistakes – so try whatever looks interesting.
- The main PT app window shows a bottom menu tray which gives you the ability to add to the topology. Experiment with moving different kinds of devices into the topology. Once added, open the detail window for each device and explore the tabs included for each device type.